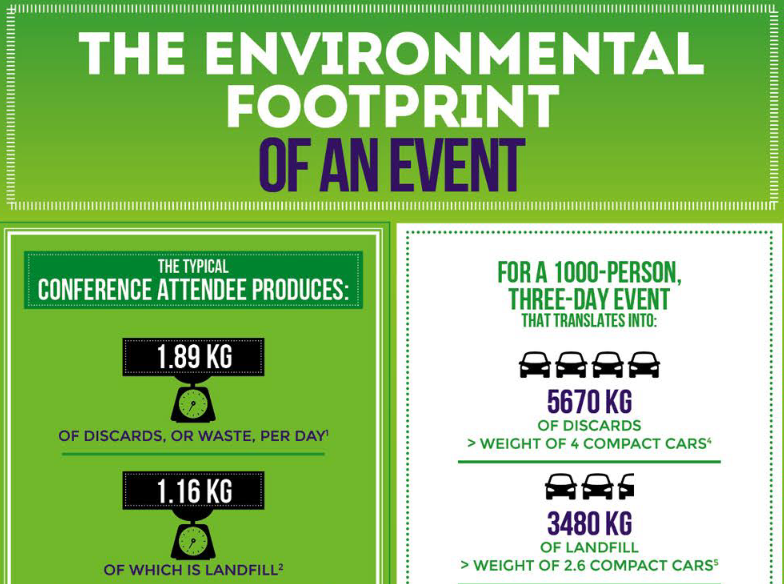
Here is a handy infographic that shares researched information about a typical conference event footprint. The aim: to give you an idea of what to measure, how to measure and a few tips you can follow to shrink your waste and carbon footprint.
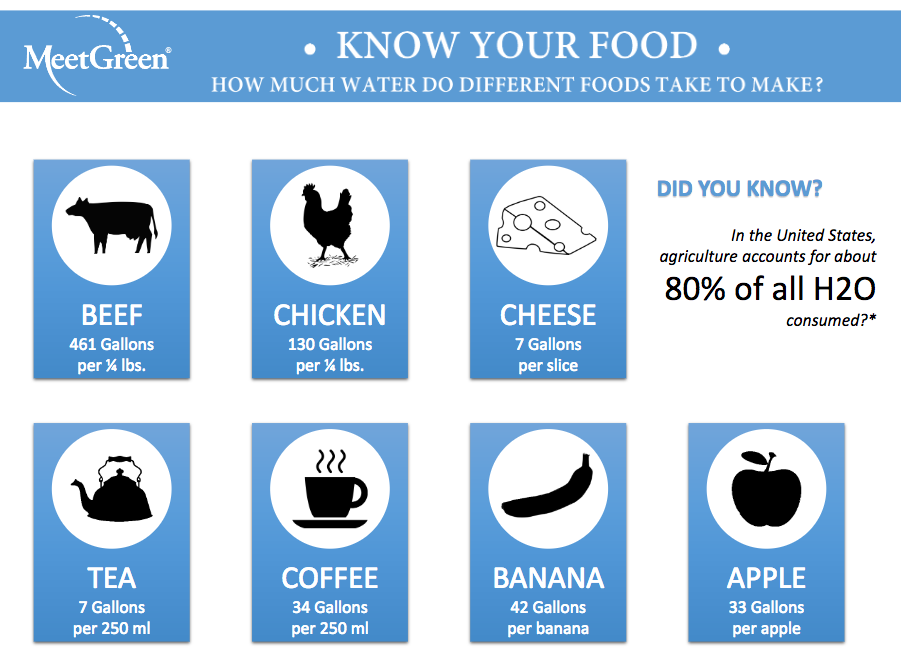
Know Your Food
meetgreen2026-05-13T20:31:07+00:00Do you know your event food choices effect water consumption?
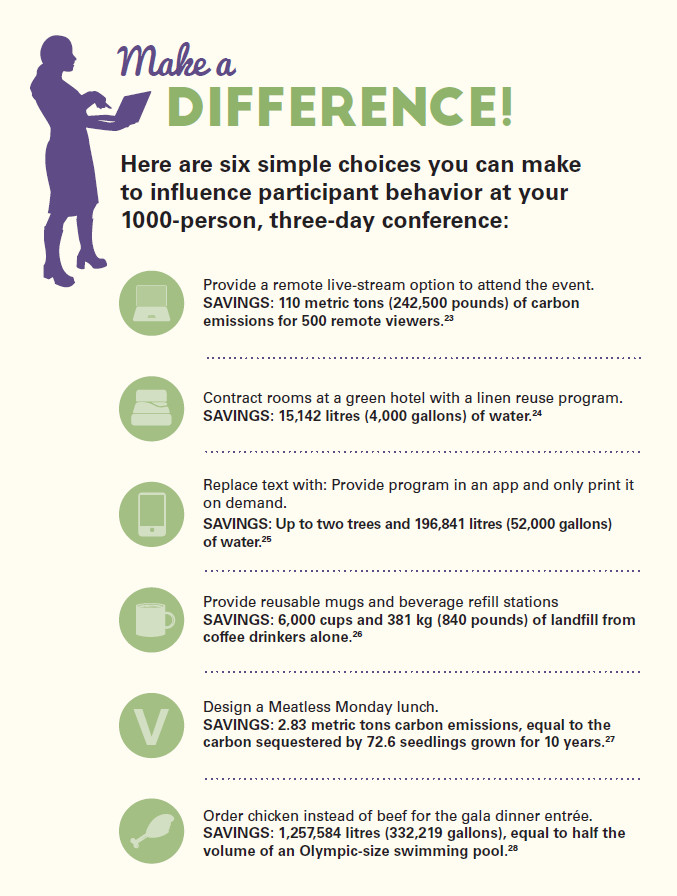
Influence Participant Behavior
meetgreen2026-05-13T20:31:50+00:00Six simple choices you can make to influence participant behavior at your event. From the book "Meet Better".
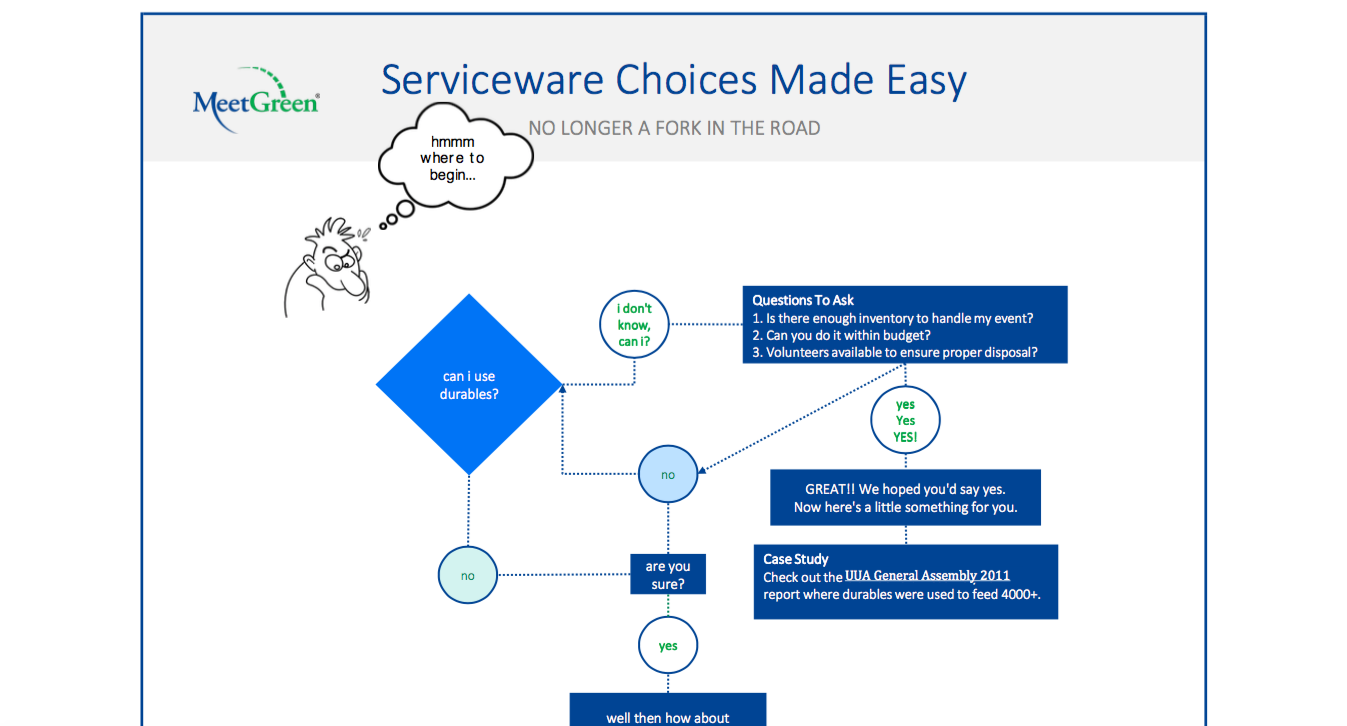
Serviceware Made Easy
meetgreen2026-05-13T20:32:43+00:00There are many factors to consider when choosing serviceware for your event. Let this infographic guide you through the process.
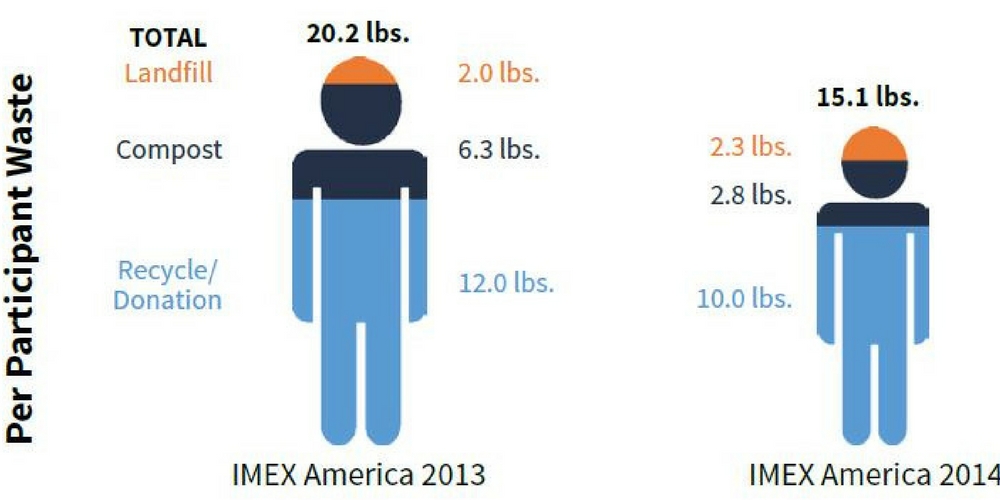
Waste Diversion for IMEX
meetgreen2026-05-13T20:33:15+00:00IMEX America has improved on their waste diversion year over year. Learn more in the case study.

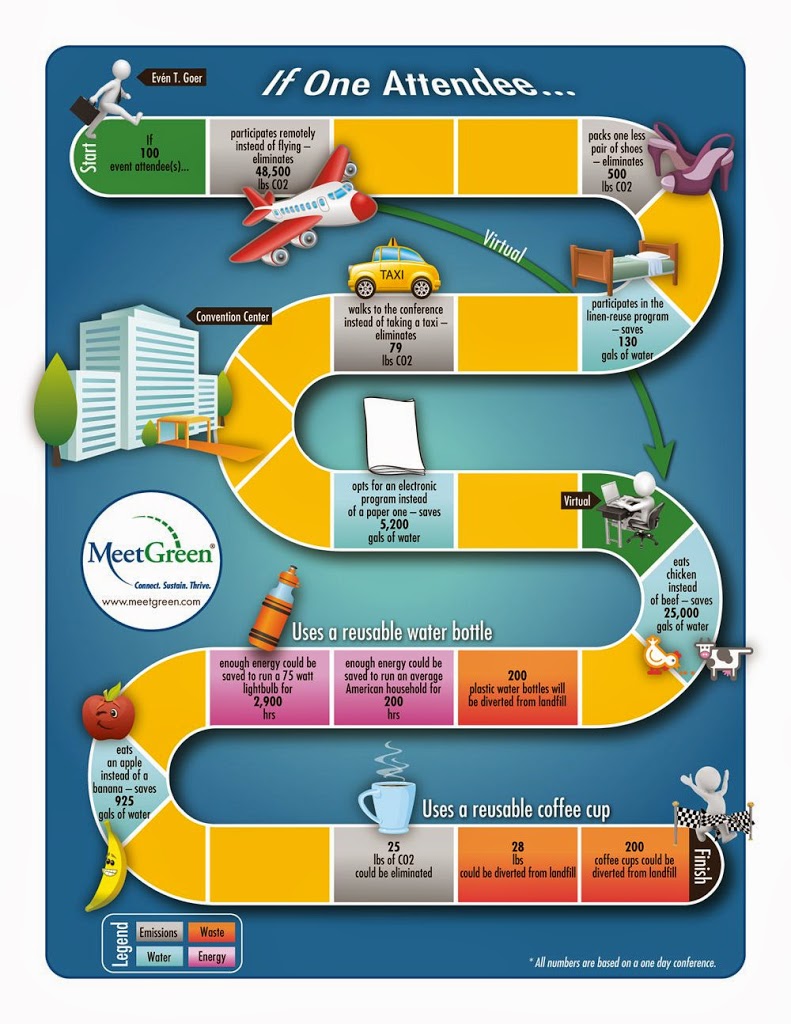
If One Attendee
meetgreen2026-05-13T20:33:56+00:00What kind of positive sustainable impact can attendees have on an event? Full calculator version available as part of the MeetGreeen® Sustainable Event Kit.
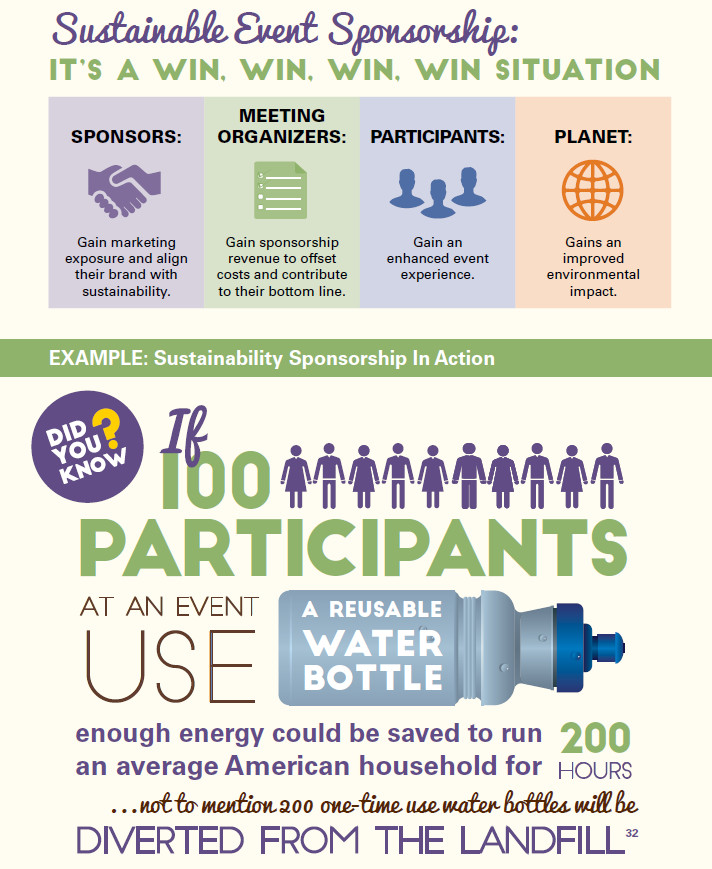
Sustainable Event Sponsorship
meetgreen2026-05-13T20:34:30+00:00This infographic from the book, "Meet Better – 167 Ways to Make Your Events More Environmentally and Socially Responsible", shares how sponsored reusable water bottles can make a difference.
Oracle OpenWorld India 2017
meetgreen2026-05-13T20:34:58+00:00Oracle faced a number of systemic challenges in working to make the first Oracle OpenWorld India a sustainable event. As a result, Oracle focused evaluating opportunities to reduce, reuse and donate materials to minimize waste. Read Case Study
IMEX America 2016
meetgreen2026-05-13T20:35:23+00:00The 2016 IMEX America, our own internal planning team took a proactive approach to recycling the materials that we use for signage and, together with our vendors, ensured that they were put to valuable use in several different places (see Materials). We also reduced our paper use from onsite publications by more than 1,500 lbs [...]
Oracle OpenWorld Latin America Division 2016
meetgreen2026-05-13T20:35:48+00:00Attendees in Sao Paulo, Brazil generated 60% less waste per person than in 2010. A contributing factor to this reduction was all signage was either recyclable, repurposed as a different item, or reused. Read Case Study