
Learning how to avoid single-use plastic at events is one of the most effective ways to: Reduce waste Lower your environmental impact Create a more sustainable attendee experience From disposable water bottles and plastic cutlery to giveaway packaging and food service items, single-use plastics contribute significantly to event waste and often end up in landfills [...]
Sustainable Event Survey for Event Venue RFPs
Justine Pretorious2026-05-13T15:49:07+00:00The Sustainable Event Survey for Event Venue RFPs has been designed to accompany your organization's Request For Proposal. Send this document along with the full RFP and request the venue fill it out and return. Answers will help planners understand the venue's level of sustainability and commitment.

Back of House Tour
Justine Pretorious2026-05-13T17:01:54+00:00A back-of-the-house tour of the event facility takes you behind the scenes and can help ensure that planned sustainable initiatives are taking place. Request a tour in advance for both site selection visits and onsite during the actual event. Include the request in your RFP and contract with the facility. Use this handy checklist when [...]

How Many Meals Can One Metric Ton of Carbon Serve
Justine Pretorious2026-06-01T18:43:33+00:00How many meals can one metric ton of carbon serve? This question may not be top of mind but it should be. A carbon friendly menu is impactful by the foods you choose to serve. It isn't something you might take into consideration but it definitely can make the difference when you are planning sustainable [...]
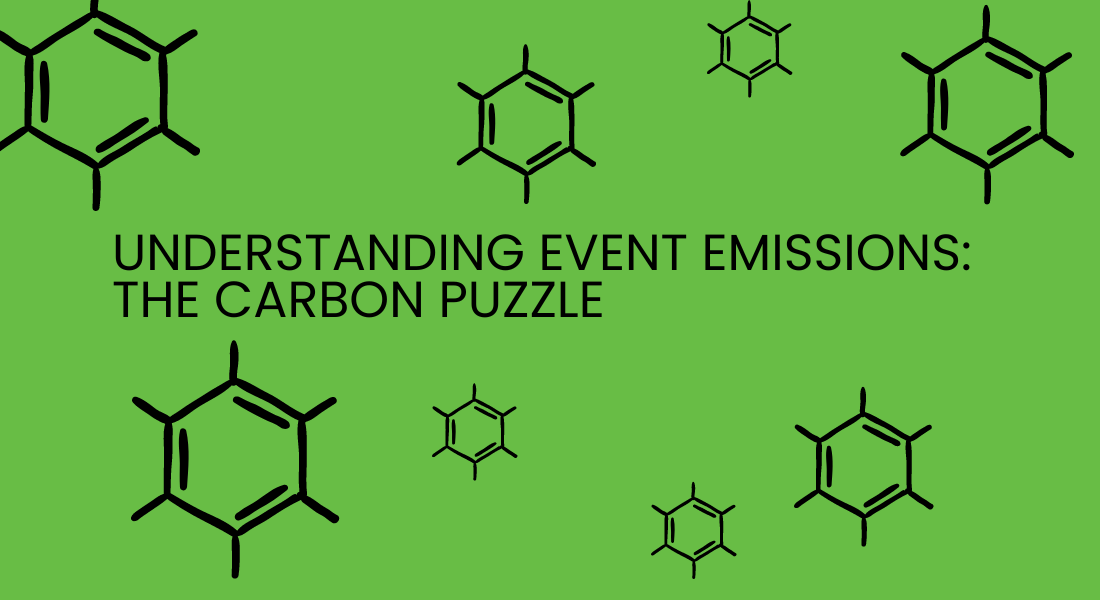
Understanding Event Emissions: The Carbon Puzzle
Justine Pretorious2026-05-13T18:38:27+00:00Event emissions are complicated. We understand there's a lot to take in and process. This infographic breaks down each of the components from the largest to the smallest event emissions footprint. Understanding emissions sources is key to achieving significant carbon reductions at events.
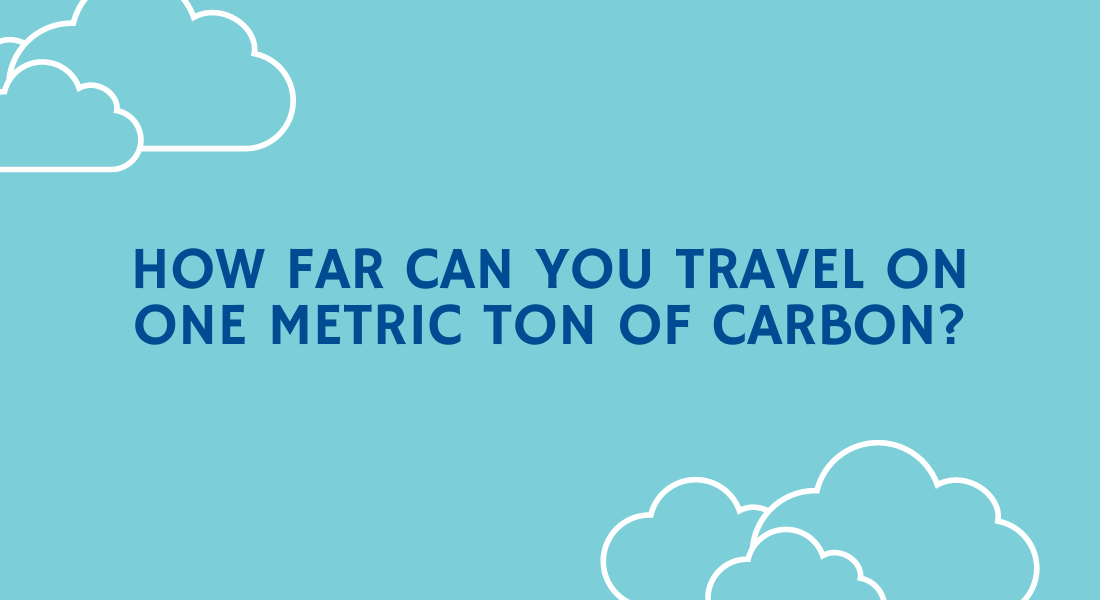
How Far Can You Travel on One Metric Ton of Carbon?
Justine Pretorious2026-05-13T18:39:25+00:00Have you ever wondered about your carbon footprint for travel? If so, we have an infographic for you! We measured out how far someone could travel on one metric ton of carbon. One metric ton is the equivalent of 1,000 kg or 2,204 lbs. How far will that take you? One metric ton can only [...]
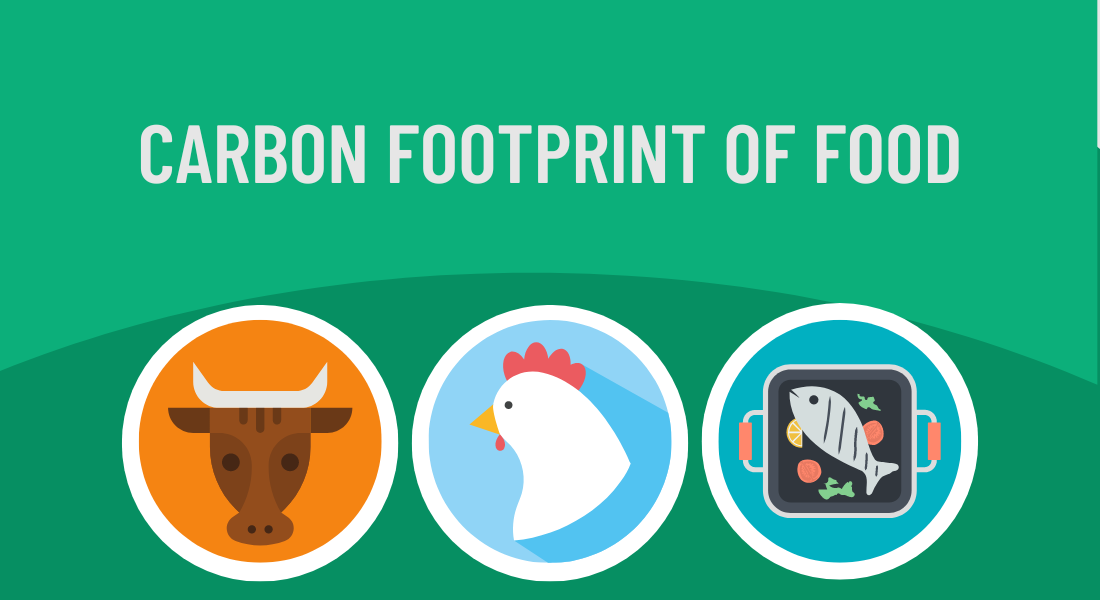
Carbon Footprint of Food
Justine Pretorious2026-05-13T18:41:46+00:00What do you know about your event menu and its carbon footprint? Planning a sustainable menu should also include consideration of the carbon footprint. The "Event Food Carbon Calculator" was used to create this infographic that show's the carbon affect on a 100 person event meal. Rating the foods we selected as high, medium, or [...]

Hybrid Event Do’s and Dont’s
Justine Pretorious2026-05-13T18:43:05+00:00Do's and Don'ts for hybrid events can look daunting. What do you know about planning a hybrid event? Combining an in-person and a digital component may be overwhelming. Our team has put together a list of Do's and Don'ts for hybrid events. Learn from our experts and their real world experience.

Ten Steps to a Sustainable Event
Justine Pretorious2026-05-13T18:52:43+00:00Don't know how to get started? Here's 10 steps that will help you plan your next sustainable event!

Environmental Footprint of a Hybrid Event
Justine Pretorious2026-05-13T18:57:37+00:00While attending virtually still requires energy, this infographic illustrates the average virtual attendee emitted 95% fewer emissions than an in-person attendee at a hybrid event.